Recovery Timelines After Intense Fixtures Unlock Overlooked Selection Patterns Across Soccer Leagues, Tennis Tours, Basketball Seasons, and Thoroughbred Circuits
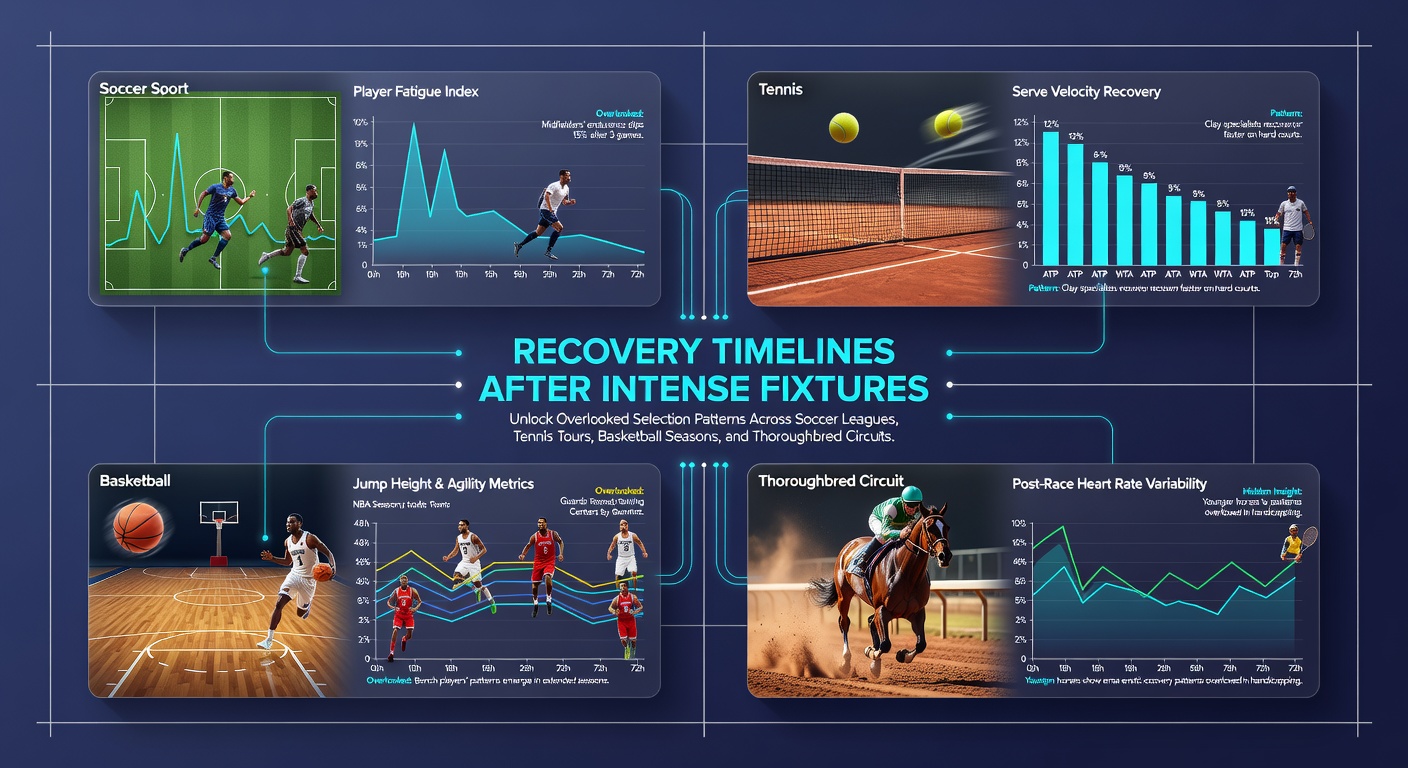
Recovery timelines after demanding fixtures reveal consistent patterns in how athletes and equine competitors regain peak condition across multiple disciplines, and these patterns influence team selections as well as individual entries in subsequent events. Data collected from major leagues shows that soccer players require between 72 and 96 hours to restore muscle glycogen levels following matches exceeding 90 minutes, while tennis professionals often need five to seven days to normalize serve velocity after five-set encounters. Basketball organizations track similar windows, noting that back-to-back games reduce three-point accuracy by measurable margins until rest periods extend past 48 hours, and thoroughbred racing circuits document stride length recovery in horses within four to six days after high-intensity sprints.
Soccer Leagues and Post-Match Physiological Markers
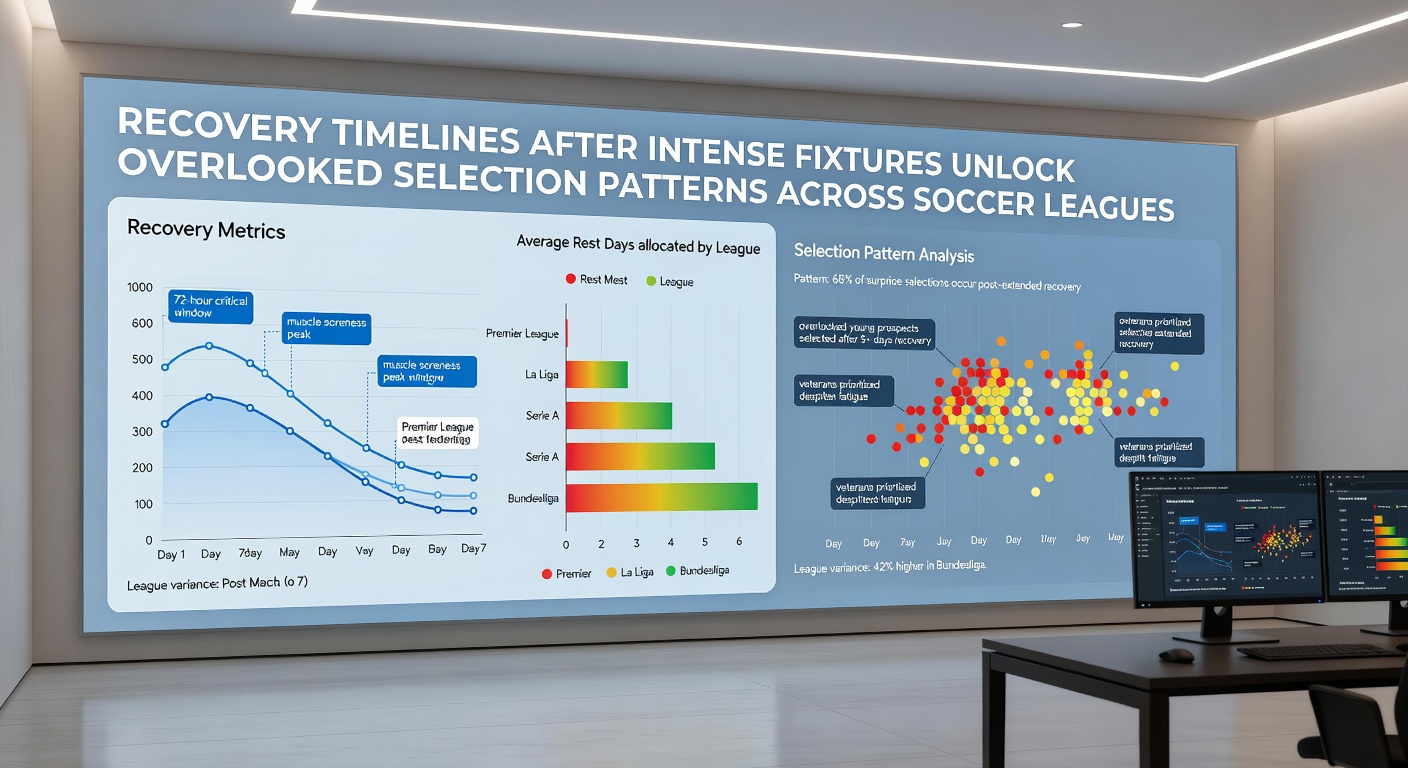
European domestic schedules in June 2026 place clubs in the final weeks of their campaigns, where fixture congestion forces coaches to monitor creatine kinase levels and heart rate variability as primary indicators of readiness. Research published by the European College of Sport Science demonstrates that defenders who log more than 11 kilometers per match exhibit elevated inflammation markers for up to four days, prompting managers to rotate personnel rather than risk reduced aerial duel success rates. Midfielders display quicker neuromuscular recovery on average, yet fullbacks require additional time because repeated high-speed accelerations compound fatigue in the hamstrings. League-wide statistics indicate that teams granting at least three full rest days before European fixtures maintain higher pass completion percentages in the opening 30 minutes compared with sides that compress recovery windows.
Tennis Tours and Multi-Day Tournament Demands
The ATP and WTA calendars in June 2026 include grass-court events leading into Wimbledon, where consecutive matches on the same surface accelerate fatigue in the shoulder and lower back. Players who compete in three matches within five days show documented declines in first-serve percentages that persist until they receive a minimum 72-hour break between rounds, according to performance data released by the International Tennis Federation. Baseline rallies lasting longer than 10 shots further extend recovery needs because they elevate core temperature and lactate accumulation. Observers note that those who schedule additional physiotherapy sessions during rest periods restore movement efficiency faster, allowing selectors to predict which competitors will sustain rally tolerance in later tournament stages.
Basketball Seasons and Consecutive Game Load Management
NBA and European league schedules during the 2025-2026 season highlight how back-to-backs affect shooting efficiency and defensive rotations. Studies conducted by the American College of Sports Medicine reveal that players logging over 35 minutes in a high-intensity contest require at least 48 hours before vertical leap metrics return to baseline, while those who receive an extra day off maintain block rates closer to season averages. Teams that monitor sleep duration alongside heart rate recovery identify patterns where guards recover neuromuscular function quicker than frontcourt players because of lower overall loading on the lower body. June 2026 off-season programs increasingly incorporate individualized recovery protocols that factor in travel distance, since cross-country flights add measurable stress that extends the standard timeline by roughly one day.
Thoroughbred Circuits and Post-Race Physiological Restoration
Racing authorities in Australia and the United States collect biometric information showing that elite thoroughbreds require four to six days for muscle enzyme levels to normalize after races run at speeds exceeding 60 kilometers per hour. Trainers who allow this window before entering horses in subsequent events record higher finishing positions on average, while compressed schedules correlate with reduced stride frequency in the final furlong. June 2026 meetings at major tracks incorporate mandatory veterinary assessments that evaluate cardiac recovery and hydration status, creating standardized data sets that reveal breed-specific differences in restoration speed between sprinters and stayers. Handlers note that fillies often rebound faster than colts of similar age when given identical rest periods, a pattern reflected in entry lists compiled by racing secretaries.
Cross-Discipline Patterns in Selection Decisions
Coaches and trainers across these sports increasingly integrate recovery timelines into selection matrices because the data produces repeatable correlations between rest duration and performance output. Soccer squads that align recovery windows with opponent analysis maintain higher duel win percentages, while tennis players who space matches according to surface-specific fatigue markers reach later rounds more consistently. Basketball organizations that publish load management reports demonstrate improved fourth-quarter efficiency when players receive prescribed rest, and racing stables that follow equine recovery benchmarks achieve better win percentages in graded stakes. These patterns emerge most clearly during congested periods such as June 2026, when overlapping international windows force precise planning across all four circuits.
Conclusion
Recovery timelines function as objective filters that shape roster construction and entry strategies throughout soccer, tennis, basketball, and thoroughbred racing. Organizations that collect and apply physiological data establish clearer expectations for when competitors regain optimal output, which in turn influences match-day and race-day decisions. The patterns documented across these disciplines continue to guide scheduling practices as calendars evolve.